|
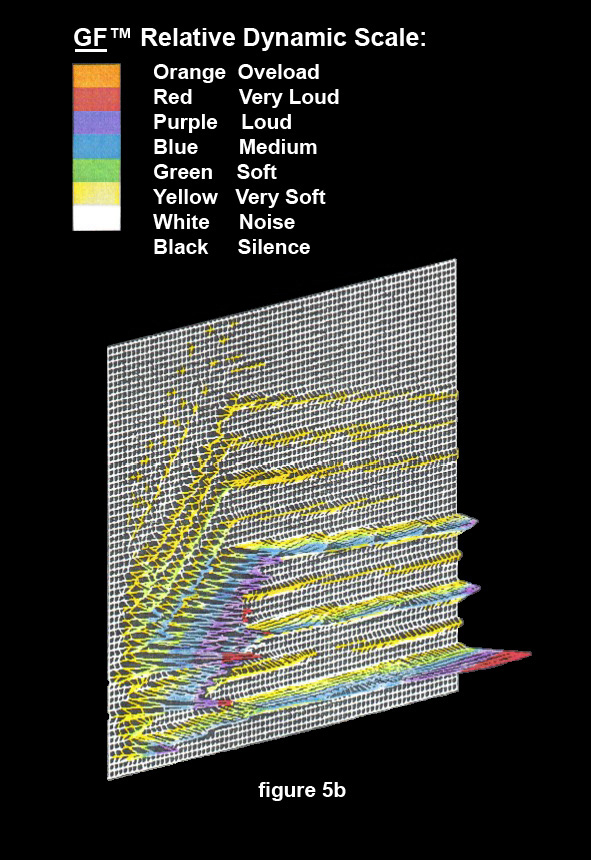
The FOURIER-BRENT Transform figure 5b photoshopped
see below for full explanation
The graphic in the title page above is an enlargement of figure 7.
FOURIER-BRENT Transform The FOURIER-BRENT Transform is the basis of GF+. GF+ is a form of music notation, which is in effect the big brother to GF-representation™. Whereas GF-representation™ uses color to describer the relative dynamics (volume) of only the the fundamental frequency, GF+™ uses the same colors to express the dynamics of the entire harmonic spectral range. This is referred to as the "spectral dynamics". The GF+™ software incorporates full-blown sampling technology into the notation package. It will also be seen that GF+™ lends itself extraordinarily well to resynthesis and additive synthesis. The FOURIER-BRENT Transform is perfectly intuitive, exactly accurate, and quite simply a much needed improvement to present practices. The trouble with 3-D representations of Fast Fourier Transforms (FFT) is that you can't see what's "behind the mountain". The FOURIER-BRENT Transform solves this problem in an elegant way. (figure 1 1989)
Figure 1 shows a musical sound that has been sampled. This is a common way to display sampled sounds, and is referred to as a 3-D FFT. Please note that this "event" has already been truncated (noise at the beginning of the sound eliminated), and that the end point has been fixed (the "tail" has been "tailored).
(figure 2 1989) Figure 2 rotates the FFT, so that the fundamental (lowest) harmonic appears at the bottom, and the higher harmonics above.
(figure 3 1989) Figure 3 is the reflection of figure2. Represented thusly, the time scale moves from left to right.
(figure 4 1989) Figure 4 is the negative of figure 3 with time data and kHz data deleted.
(figure 5a 1989) Figure 5a shows the GF™ 3-D dynamic color grid applied to the sampled sound's rotated, negative reflection .
(figure 5b 2014)
Figure 5b shows the simulated results of this application of the GF™ color scaling.
(figure 6 1989) Figure 6 shows figure 5b tilted towards the viewer for a two-dimensional bird's-eye view. This completes the FOURIER-BRENT Transform. If desired the kHz and time data can be displayed.
(figure
7 1989)
Figure 7 shows figure 6 in a minaturized form (minus background grid), which is entirely analogous to one melodic musical unit ("event") and may be placed anywhere on a GF-representation™ musical staff (Treble, Bass, or interactive) according to note number. At a tempo rate of 155.5 beats per minute (Allegro) the duration of this music event would be equivalent to one quarter-note.
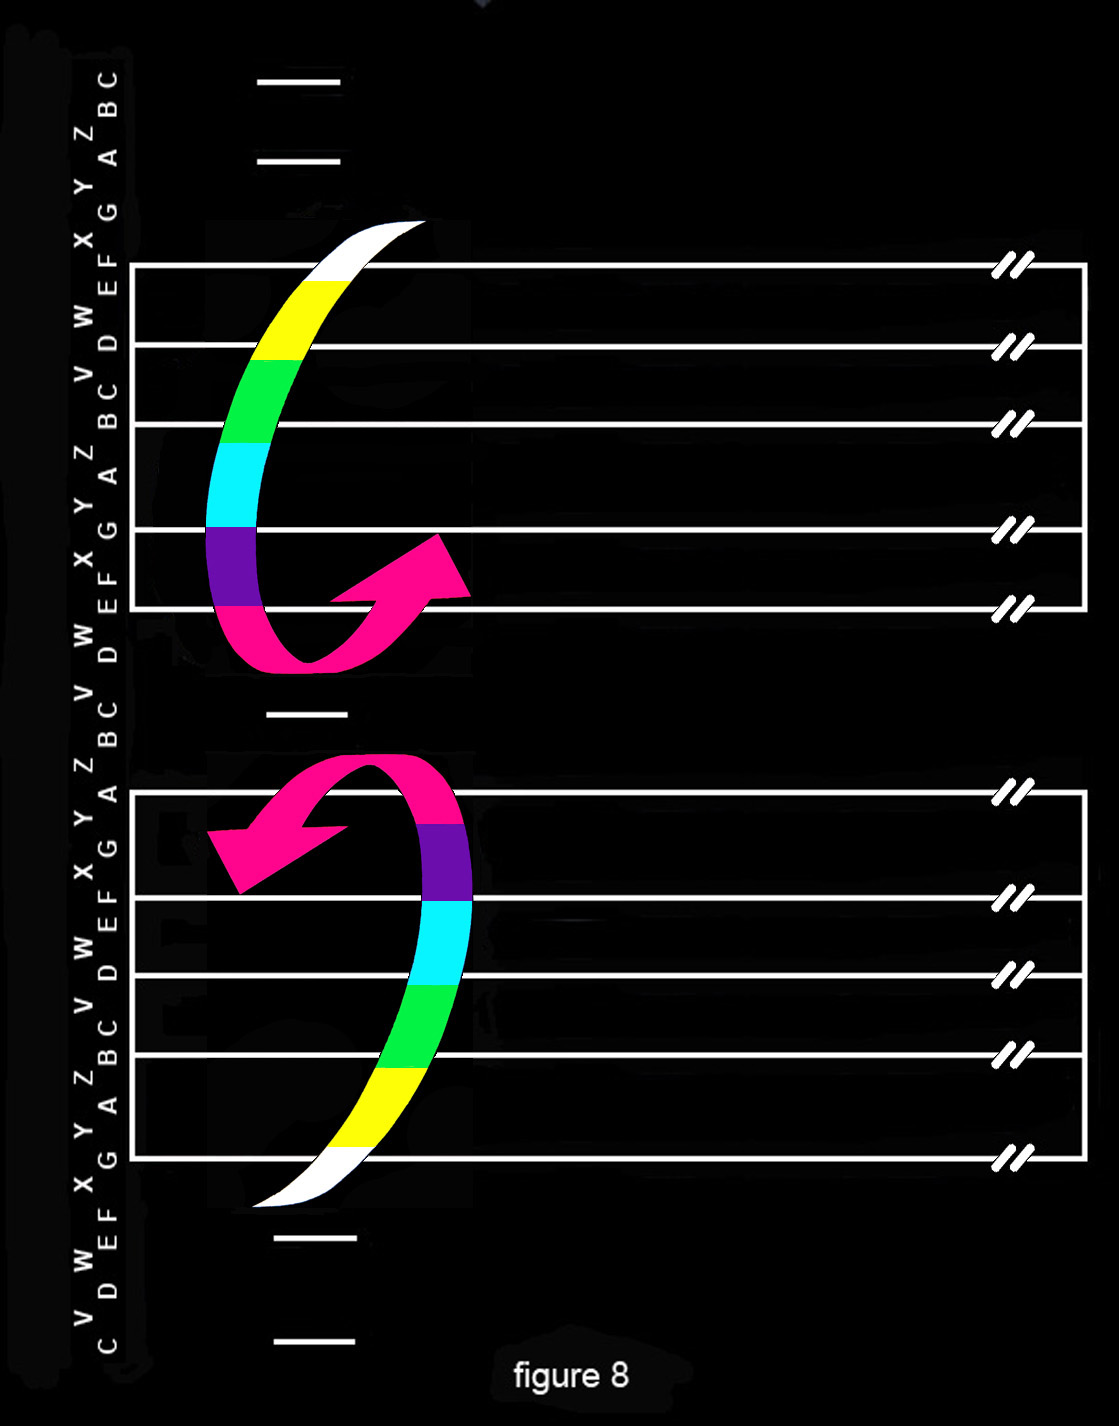
(figure 8 2014)
Orange
is Overload
Red = fortissimo = Very Loud Purple = forte = Loud Blue = mezzo- = Medium volume Green = piano = soft yellow = pianissimo = very soft
Total silence is represented (On-Screen) as black. The Yellow point (programmable, editable, and memorizable) is set just above the noise level (there will always be a certain amount of background noise in any sampled sound). As in normal GF-representation™, the Red Point and Yellow Point are adjustable (to maximize accuracy) for all events. Due to the limitations of my tools at hand, I've only been able to use solid colors in the preceding figures. In practice the colors must be finely graded by degrees. In other words: Subtly blended in minute stages to best illustrate the nuances of the sound's dynamic variations (volume changes) accurately and distinctly. The "pure" colors (Red, Purple, Blue, Green, and Yellow) can be separated by any number of "impure" progressive steps of the chromatic color wheel depending on the settings of the Red and Yellow Points. (Please see pages 66 - 70 of the GF-representation™ SOFTWARE PACKAGE DESCRIPTION 1987©J.Brent)
|


